Telegraf, InfluxDB, Grafana and a bunch of RPis
I just forced myself to do an initial inventory check of the "toys" I have in my current "to hand" tech-cave. I need to draw a picture. and I'm going to be a rebel and NOT use UML, just cos... (it'll probably end up looking very UML-like, but shush, don't tell the rebel part of my brain that)....so, where are you draw.io (oh it has a new name now, I must remember that) Not that I use the online version, I use the installed offline version - y'know, cos I'm old-skool and (insert lots of reasons here and move on).

Okay, I've gone even more old skool and used a pen & paper (I missed a few, believe it or not!), I'll do a digital version later:

What am I actually "doing" with these devices? Well a variety of things... okay, nothing really all that useful. They were purchased / used for various tasks at a specific point in time. For instance the Pi Zero was bought when it was the latest thing and I naturally bought two, I used one as the brain within a robot platform and the other was an experiment for soldering the LiPo charger and extra 4-port USB device to. I found a variety of C and Python code doing various things with OpenCV and motor controls and video processing for object detection and identification. As you can see, random stuff.
Now, however I have pretty much wiped everything (as that stuff was 4-7years old and probably no longer relevant, although some of it is only now "the norm") and have started the devices from afresh.
Whilst I determine what I want to do with these different devices, I was pondering a challenge that, again, I started a few years back and stopped pursuing - I have 4-5 R/C boats, yes, boats, ranging from 1foot in size to 5foot...and an R/C tank. I originally bought Arduino devices and zigbee modules for the comms between the devices, I even kickstarter backed a mesh network arduino based device called digispark - I have them in a box someplace still... the plan a long story, I'll be brief.
I dug a 1m deep, 1m wide "channel" between an existing pond in my garden to a new pond that I setup 20m at the other end of the garden. It was a great deal of physical work, but was a nice idea. (I have since filled it all back in and reverted back to just 1 pond). However, what I accidentally built was a Yo!Sushi coveyor belt for a Heron to stand in the middle and eat all my very expensive koi carp and all of my other fish! The plan with the boats was to have them "patrol" up and down and navigate the ponds and channel, using ultrasonic and IR devices to detect obstacles, basically the same as a robot car navigating its way around your hallway / living room. I would then have the larger boat(s) set up with cameras, they could carry larger batteries / power so could have larger devices. they would do the video / image processing onboard (and offload to a centralised RPi for processing too); the idea was to detect if a heron appeared then they would zoom up and down the ponds / channel and scare the heron away.... if this failed, then the R/C sherman tank would appear from behind the tree and shoot the BB-gun from the turret in the direction of the heron to scare it away - now, where the tank would fire would come from the data provided by the boats. You can see how all this was planned to work, the arduino devices were simple, single task devices, the RPis could do a bit more and it used simple MQTT pub/sub comms over TCP/IP to share data...I did get distracted about using non-TCP/IP protocols for a while. anyway, as I say, after losing the 3rd round of fish, it was cheaper, easier, simpler to just fill in the channel again and rewind the whole exercise. The boats and devices went back into boxes.
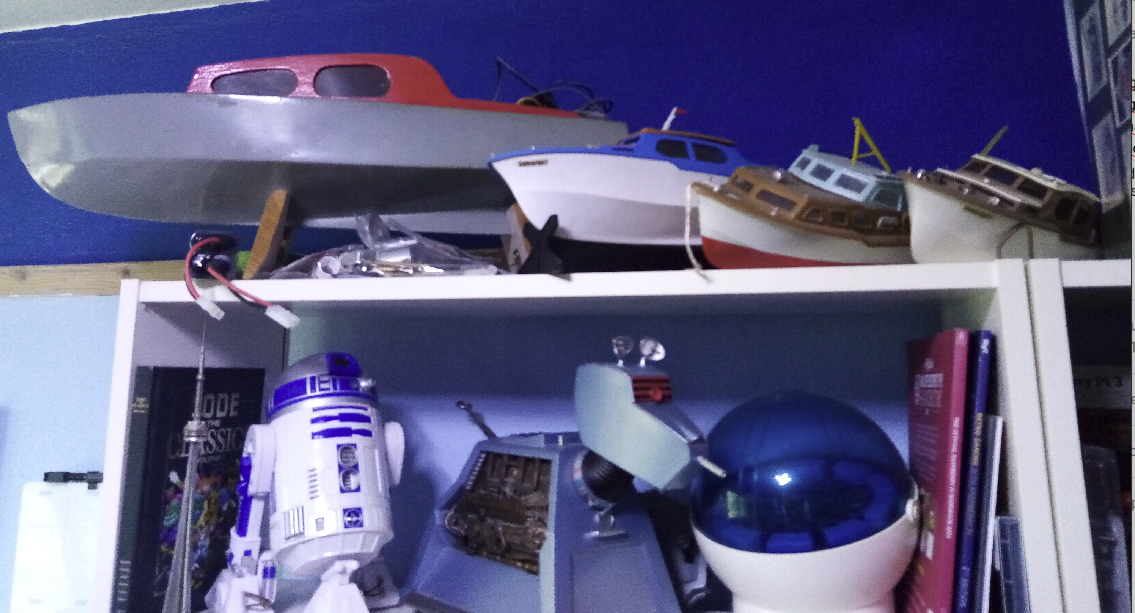
...and if you think I'm just talking BS!t, here's the evidence / proof (sigh, sad world we live in where I have to justify everything, but here you go..... "if there is no video / photo, it didn't happen, Grandpa")


What has this got to do with Telegraf, InfluxDB and Grafana? I'm getting there...I'm getting there, I'm setting context for you :-D
I was pondering a challenge for doing something similar using the new RPi PICO W devices that I have got - can I use these £6 devices that have WiFi built in to do something similar? (yes, I know I have many ESP8266 devices that have WiFi too and are much smaller - I might ponder their usage too at some point)

Turns out some company called ANVIL are doing exactly what I want / need to use - they are doing secure TLS comms too. They even use the GraphQL concept that I was doing back in 2017-ish, where I passed a message that contained the function name and the params in the message - the receiver would then parse those values and then execute those functions with those values - I was, however sticking to my AvantGo roots and was not being verbose, ie. I would not send {"do_something_function_to_process_X",1,23456,"fred",567} I would use an abc (already-been-compressed) method where that function name would be set to "4" and on the receiver side I would map "4" to that function; doesn't sound like much, but when transmitting data over a very low bandwidth you want to keep the transmission data as small as possible.
I was pondering investigating the ANVIL software a bit more, they do actually have an Enterprise version that allows you to run onPrem, not in the Cloud (who wants their data going to someone else's server in a server farm that you have no visibility of? especially as it looks like it is AWS too... I don't have any super-secure data, but I'd rather keep everything "in-house" if that's okay?) If it means I have to change the way I write the code, back old skool style, and make it client/server style, I will.... however in this modern world, we now have the luxury of containers (note, I didn't say, "Docker containers" as that's just a brand, bit like saying "hoover", rather than vacuum cleaner - again, another debate for another time)
So...I could write my own code in C, or even in MicroPython...that would use some code to broadcast it's presence to other devices in the network it is connected to (potentially using arp -s IP MAC to set a static arp table setting of the IP/MAC address), then I'd have to build the next layer up, - oh did I mentioned I want the devices to be able to talk to a centralised server as well as adhoc between each other? yes, again ESP8266 can work in adhoc wifi mode and then can all connect to each other, but again, another digression...

As I'm getting older, I'm starting to become more of a Terry Pratchett university wizard and find myself finding ways to "not do magic"... or as in my case, finding ways to "not write code"....
----------------------------------------------------------------------------------------------------
That's where Telegraf comes into the equation! FINALLY!


So, what does all that mean?
Well, for most people, it allows them to gather statistics from a device, such as CPU usage, RAM usage, TEMP, DISK IO, etc..etc... in fact, I did actually set this up (explained below) on the RPi devices so I can see this data on a centralised Grafana dashboard.
However, as I was setting this up I noticed that I can use [[inputs.exec]] to execute a bash shell script and return the result of that script as a message that then gets transmitted and stored within the InfluxDB bucket of choice... hmmm.....:eyebrow-raised:
I wonder if I can use the [[inputs.exec]] plug-in aspect to gather data from one device and transmit it to another? At the moment, the way Telegraf is setup it will send data to a Grafana instance on a specific IP, which fits nicely with my centralised data repo. for the RPi status dashboard. I wonder if I can extend this concept to build my own plug-in to do the mesh-network comms and use Telegraf to do this? Keep this thought in mind, I'll come back to this in a later post.
For now, and as a instruction list for me to repeat onto each new device, I'll list out the steps for setting up Telegraf on a new RPi device to work in my environment.
I have an existing RPi 3 B+ (possibly?) that is clamped inside a 7@ touchscreen that shows me the Solar Panel & Battery status Grafana dashboard. It has InfluxDB, Grafana and Node-Red installed. Node-Red parses the modbus data from the MPPT controller and then saves the data to an InfluxDB bucket, then I have a basic Grafana dashboard pointing to that data source.

To setup InfluxDB and Grafana onto an RPi is dead simple:
GO TO A PREVIOUS ARTICLE I WROTE AND FOLLOW INSTRUCTIONS
Now, you've setup InfluxDB to be listening on port 8086 and you've got Grafana listening on port 3000.
Sweet.
Right, now to setup Telegraf.
Pop over here and find the latest release version url link:
https://github.com/influxdata/telegraf/releases
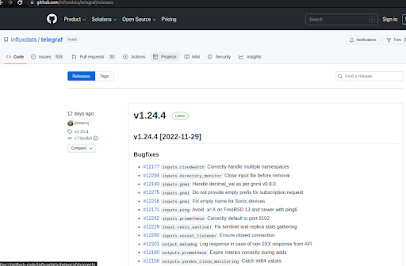

It'll be something like:
https://dl.influxdata.com/telegraf/releases/telegraf_1.24.4-1_armhf.deb
Right, get onto the RPi you want to install Telegraf onto and type (I've assumed you've already installed an OS and get WiFi working etc...):
$ cd Downloads
$ wget https://dl.influxdata.com/telegraf/releases/telegraf_1.24.4-1_armhf.deb
$ sudo dpkg -i telegraf_1.24.4-1_armhf.deb
This will now install Telegraf. We don't need the file anymore, so clean up.
$ rm tele*
Well, it is installed, but we need to configure it. That file exists in:
$ sudo nano /etc/telegraf/telegraf.conf
We can use the DEFAULT config file as-is for now, but make the following tweaks (as I'm lazy I inserted the [[inputs...]] section above the [[outputs...]] as I couldn't be bothered to scroll down for 1/2 a mile:
[global_tags]
intervals = "30s"
collection_jitter = "5s"
flush_interval = "5s"
quiet = true
[[inputs.exec]]
commands = ["/usr/bin/vcgencmd measure_temp"]
name_override = "temperature_gpu"
data_format = "grok"
grok_patterns = ["%{NUMBER:value:float}"]
[[outputs.influxdb]]
urls = ["http://192.168.0.20:8086"]
database = "pi_logs" #I originally used a different bucket for each machine, but can use same one
retention_policy = ""
write_consistency = "any"
timeout = "10s"
#never sure if this is right or needed?
username = "grafana"
password = "password"
[ctrl+x, y]
Let's enable the service to run on boot up:
$ sudo systemctl enable telegraf
We're going to add an extra temp value setting for the GPU temp with the following:
$ which vcgencmd
/usr/bin/vcgencmd
We have to allow permissions for the telegraf user to be able to access the video GPU:
$ sudo usermod -a -G video telegraf
$ sudo -u telegraf vgencmd measure_temp
temp=42.4'C
$ sudo systemctl restart telegraf
Now, data is being captured and being sent into InfluxDB... within the datasource called "pi_logs".
That's it (for now).
UPDATE:
#In order to monitor both Network interfaces, eth0 and wlan0, uncomment, or add the next: [[inputs.net]] [[inputs.netstat]] [[inputs.file]] files = ["/sys/class/thermal/thermal_zone0/temp"] name_override = "cpu_temperature" data_format = "value" data_type = "integer"
Step 2 = let's "see" the data in a Grafana dasboard. The important number to remember is 10578
Open up a web browser to your grafana, in my case: 192.168.0.20:3000
Click on the Dashboard icon on the left-hand-side and then select [IMPORT] (that is crucial!)
Enter the number 10578 - that is a pre-made template. I did attempt to do all of this myself and after about 30mins I gave up and found this template. Once you have a copy of it though, you can copy / extract the JSON definition and make your own variants. So, go get it first....

Press the [Load] button.

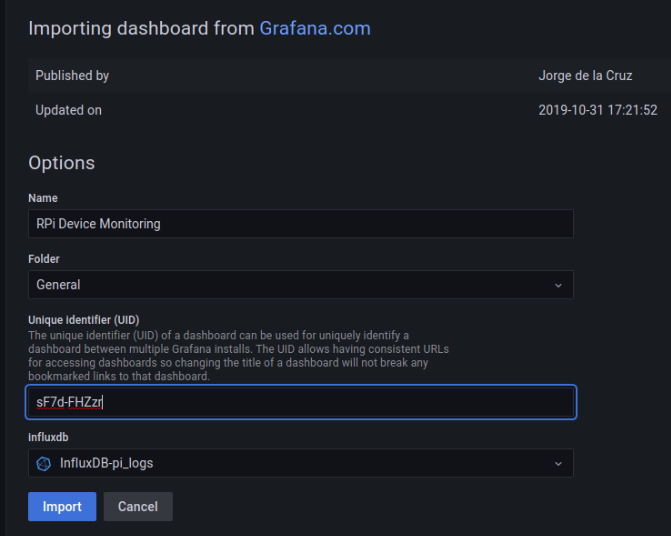
So, there are a few things to note here.
First, I changed the Dashboard name - obvious.
Second, you'll see I've imported this template before, and it tells me that the GUID is already in use - so just press the button to generate a new one.
Third, and the most import one - at the bottom, you do not have a datasource setup to point to the InfluxDB "pi_logs" bucket.... Chickend and Egg here. You can create the template and then go back and create the datasource and then go change the dashboard... or, as I'm about to do, cancel this; go create the datasource and then come back and do this step. Why didn't I do that in these steps? Well, because it is not obvious / logical and, well, I forgot :-D
Click the gear-cog icon for Configuration settings and select datasources and then press that big button on the top right for a NEW one:


[Save & Test] - all done. Now, back to the Dashboard Import. You should be able to figure out what to do now.
Press [Import] button....
You will now see this Dashboard. Select from datasource [Influxdb-pi_logs] and then you have the ability to select the Raspberry Pi device to view, you can see that I have two listed here.... I need to change the hostname of that RPi3A+ device to not be 'raspberrypi' (hey, I only just set it up for this exercise and forgot to change it).

So, as I said earlier, you can now use one dashboard to view the lens of each Pi in the same dashboard by selecting the hostname from the dashboard.
Or, you can do what I'm about to do... and that is make a new dashboard that has that top guage bar for each RPi device one under each other so at a glance I can see the high-level status of each Pi device on one screen.
PiZero:

RPi3A+:

-----------------------------------------------------------------------------
Well, that shows how to use Telegraf to capture data from each Raspberry Pi device (okay, only 2 atm, but I'll install onto every device and laptop going forward - might even get onto Android devices? if supported?). Then how to view that data in a centralised manner via Grafana from a InfluxDB datasource.
As I say, the next step will be to look at abusing Telegraf to do other things with that [[inputs.exec]] section - appreciate that this is currently also one-way, ie. it reads data from device with Telegraf and sends to InfluxDB, it isn't two-way to send data back.
Maybe Telegraf will not be the answer to what I am looking for...and I'll have to continue looking...or end up writing my own...or looking into more node-red nodes to see what that can do, along with some custom C / MicroPython code running on the devices.
Who knows what will happen over the Dec/Jan time frame? Maybe I might even get those boats and tank up & running.... after the Robot cat/dog / TurtleBot 3 / 4WD robot car - ah, too many "toys", too much choice" and never enough "time".


Comments
Post a Comment